
Basic overview of Xcode
Xcode is the primary tool used for the development of Mac and iOS applications. This is a free tool which can be downloaded from developer.apple.com website. You can use Xcode for Writing code, Building, Testing (Unit test) and for Distribution (Submitting to App Store). Xcode, Apple’s integrated development environment (IDE), has several panes designed to help with different aspects of app development. Each pane serves a specific purpose and enhances the development workflow.
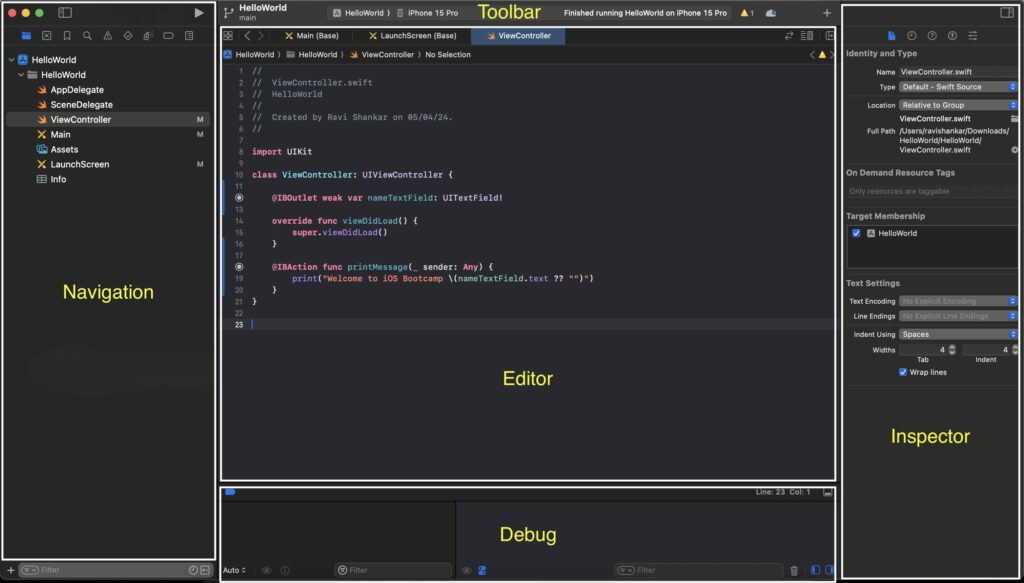
Here are the primary panes in Xcode:
Different Panes in Xcode
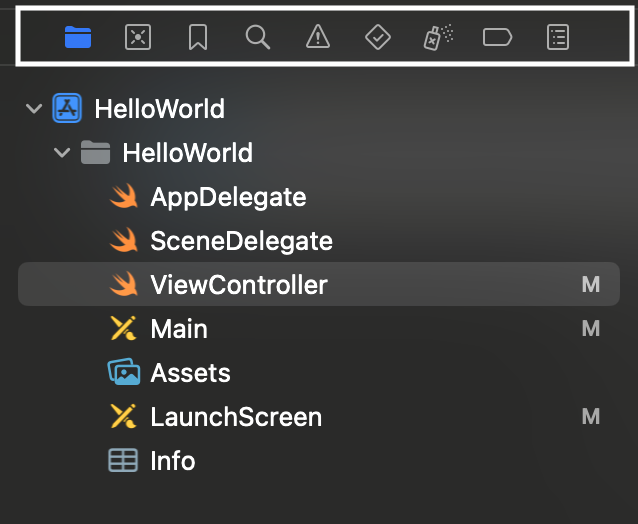
Navigator
This is available at the left hand side of Xcode window. The Navigator Pane is where you can switch between different navigators to perform various tasks:
-
Project Navigator: Browse files in your project.
-
Symbol Navigator: View the symbols in your project like classes, methods, properties.
-
Find Navigator: Search your project.
-
Issue Navigator: See compile errors and warnings.
-
Test Navigator: Run and manage your tests.
-
Debug Navigator: Inspect runtime information and performance.
-
Source Control Navigator: Manage source control repositories.
-
Report Navigator: Access build logs and activity.
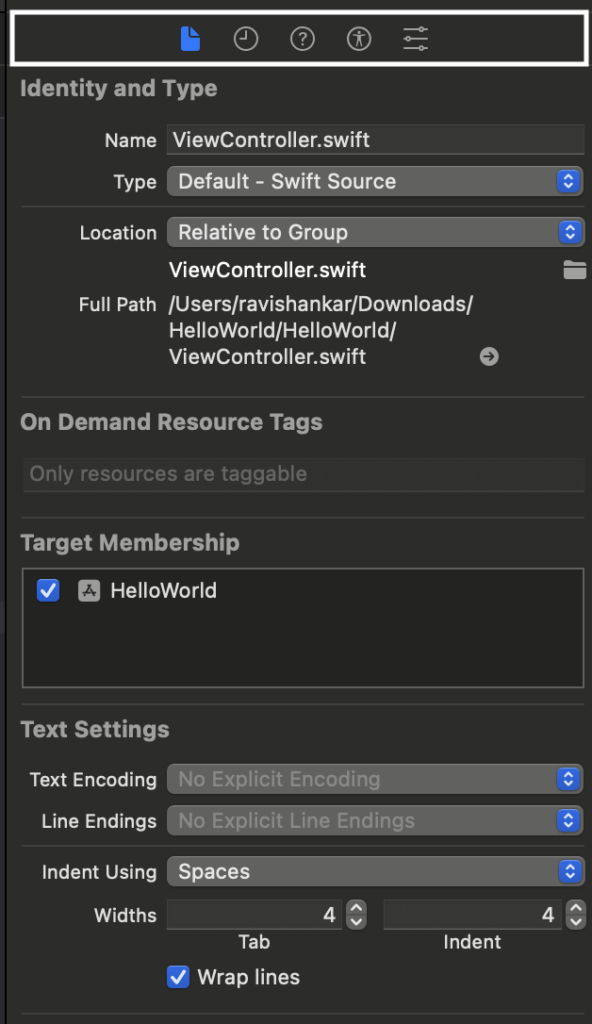
Inspector
This is available at the right hand side of Xcode window and is context-sensitive, changing based on what you’re doing in the Editor Pane. It includes:
-
File Inspector: View file properties.
-
Quick Help Inspector: Get documentation about the selected code.
-
Identity Inspector: View the identity and type information for a UI element.
-
Attributes Inspector: Set attributes for UI elements.
-
Size Inspector: Adjust size and position of UI elements.
-
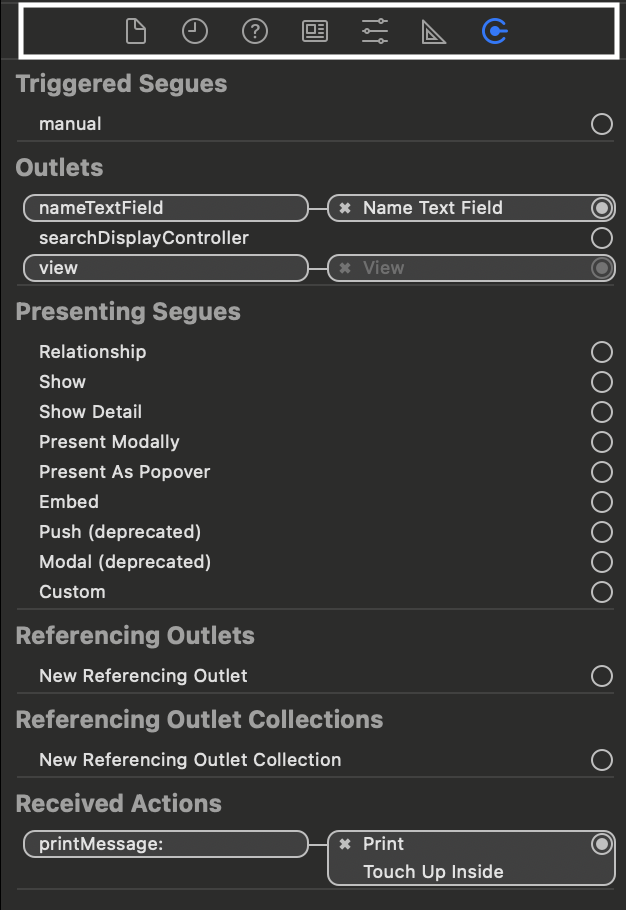
Connections Inspector: Manage connections like outlets and actions.
-
History Inspector: See information about Git commits for that file.
These tools help the developer with designing the user interface and writing coding using Xcode.
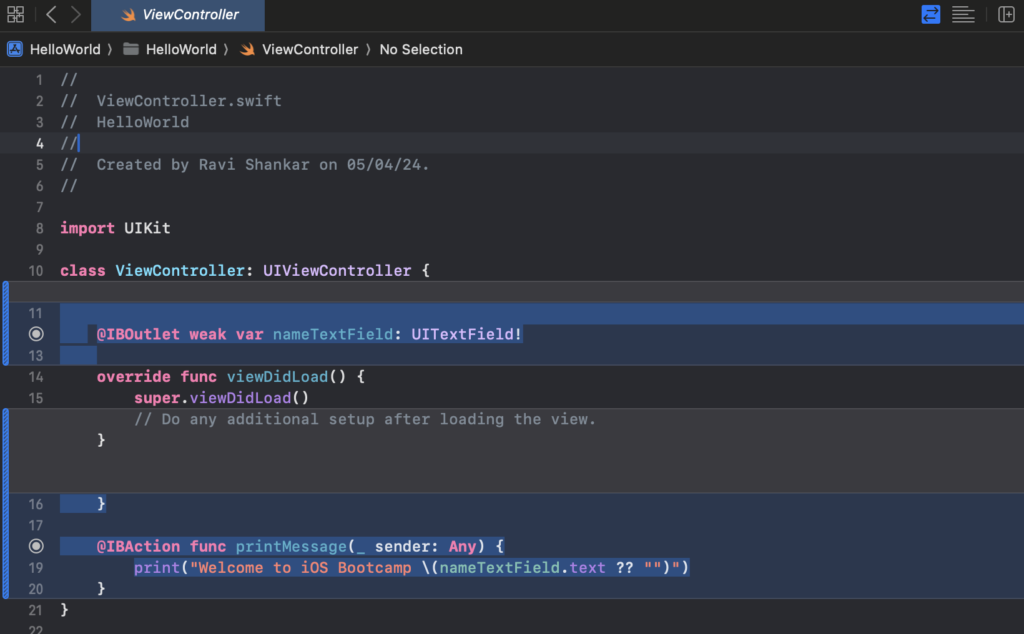
Editor
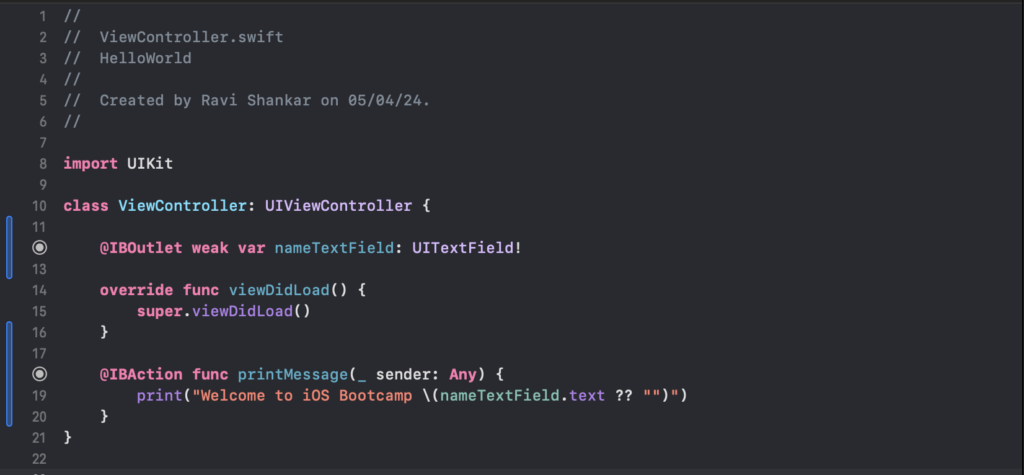
The central area of the Xcode window is the Editor Pane where you can write and edit code. Depending on what you are doing, it can show:
- Source Editor: Where you write code.
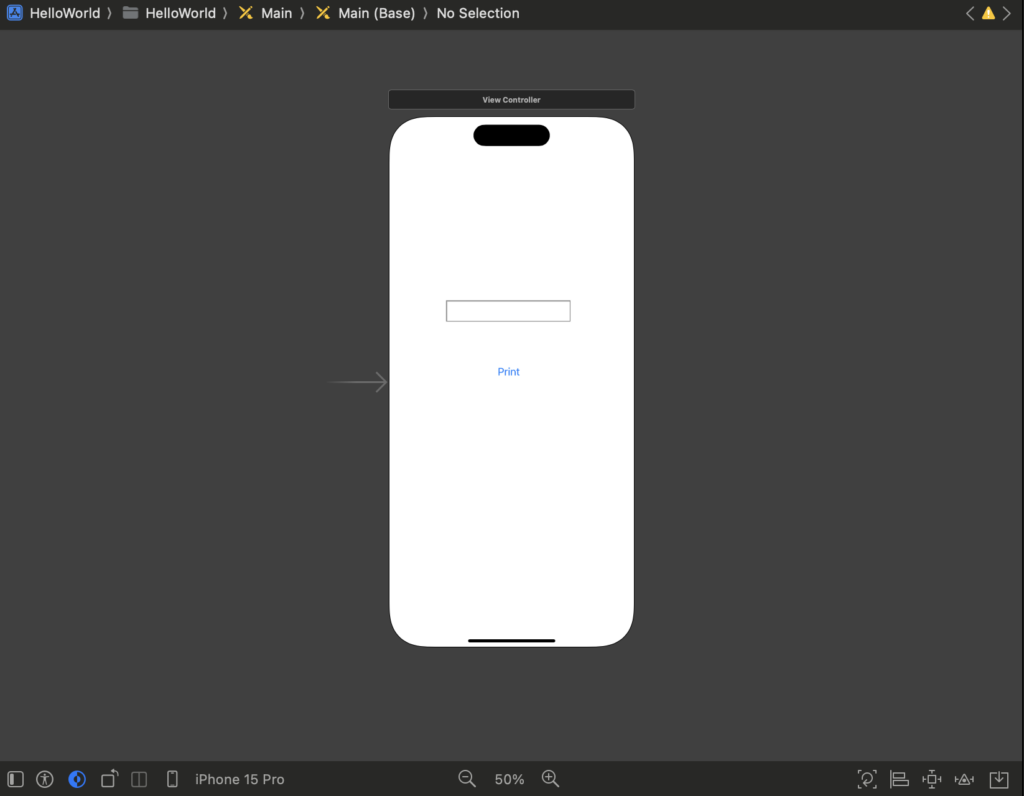
- Interface Builder: Drag and drop to design your app’s UI This is displayed in the centre when you navigate to your .xib file or storyboard.
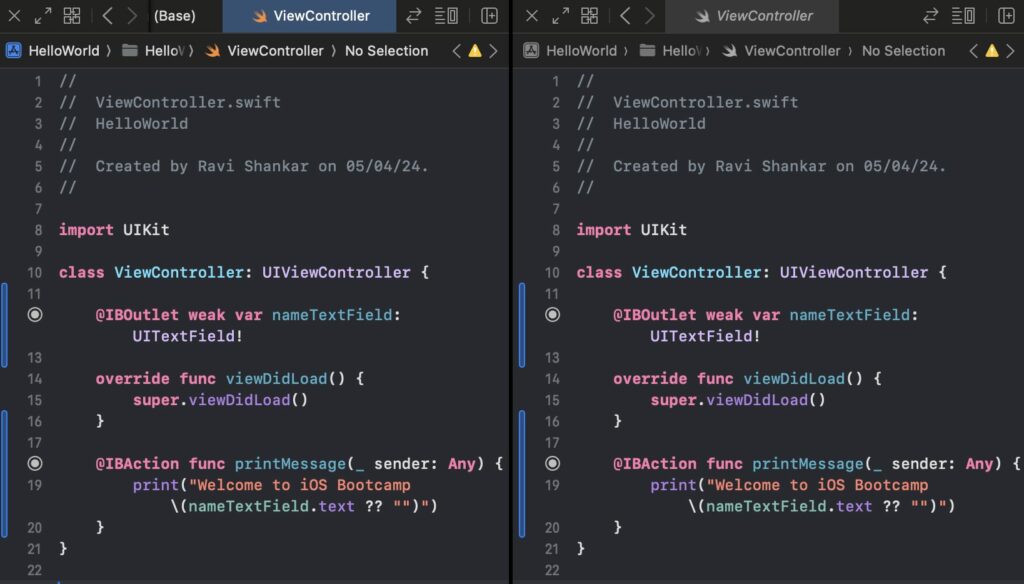
- Version Editor: Compare different versions of your code.
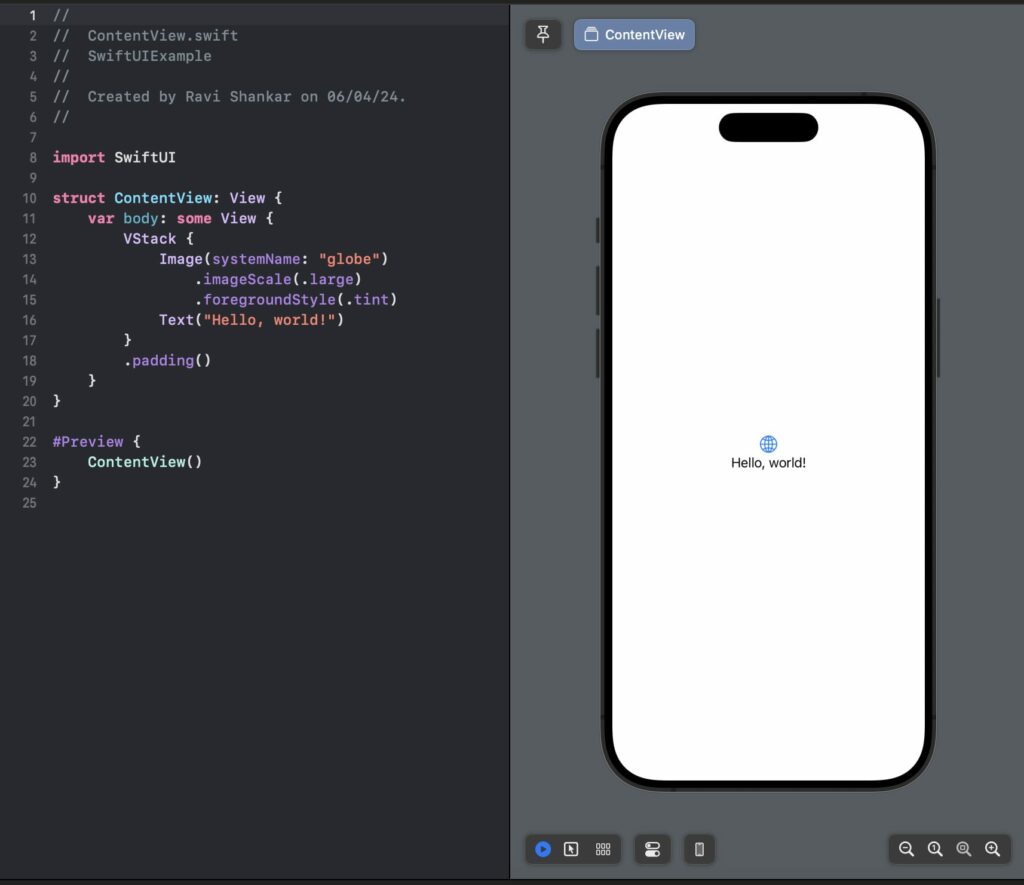
- Canvas: Work with SwiftUI previews.
- Code Review: Review the last un committed changes.
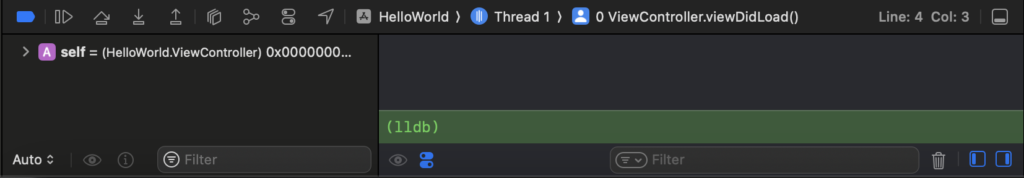
Debug and Console
Debug and Console panes are available at the bottom of Xcode window. As the name suggests Debug provides option for debugging your app and console displays both system, exceptions and app written messages.
-
Variable View: Inspect variables during debugging.
-
Console: View output and logs, interact with the LLDB debugger.
Toolbar
Located at the top of the Xcode window, the Toolbar lets you:
-
Run and stop your app: Build and run or stop your app.
-
Active scheme and destination: Select the device or simulator to run your app on.
-
View selectors: Show or hide the Navigator, Debug, or Utilities panes.
